Mount Pleasant is known for a lot of good things. The word has been spreading and that’s why the town is so popular and has grown so much. This growth has brought an abundance of opportunities. For example, East Cooper is now known for having the best schools in Berkeley, Dorchester and Charleston counties and always ranking among the top in the state.
Along with the growth comes a variety of housing opportunities. To help you find the neighborhood that fits your family’s needs in the right location, we put together some 2016 facts and stats by neighborhood. We divided the information into north and south Mount Pleasant and the islands.
We hope this information will help you find that perfect home in the ideal location.
For additional information about the area visit:
www.MountPleasantMagazine.com
www.MountPleasantHomes.com
www.ILoveMountPleasant.com
NORTH MOUNT PLEASANT
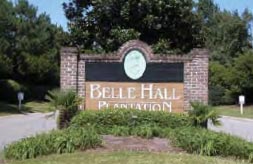 BELLE HALL 2016 SALES
74 Belle Hall single family home sales, 2016, from $303k-$1.4M. Median sales price $420k, $231/sqft., 5 over $1M.
BRICKYARD 2016 SALES
39 Brickyard single family home sales, 2016, from $345k-$1.7M. Median $469k, $186/sqft., 2 over $710k. 1 under $420k.
CAROLINA PARK 2016 SALES
172 Carolina Park single family home sales, 2016, from $399k-$1.1M. Median $557k, $208/sqft.
CHARLESTON NATIONAL 2016 SALES
58 Charleston National single family home sales, 2016, from $280k-$1.2M. 2 over $600k. Median $387k, $173/sqft.
DARRELL CREEK 2016 SALES
20 Darrell Creek single family home sales, 2016, from $460k-$1.6M. 1 over $1M. Median $617k, $186/sqft.
 DUNES WEST SALES 2016
159 Dunes West single family home sales, 2016, from $283k-$1.7M. Median $596k,$176/ sqft. 11 above $1M. 13 in Palmetto Hall subsection from $283k-$380k.
HIDDEN LAKES 2016 SALES
10 Hidden Lakes single family home sales, 2016, from $407k-$820k. Median $693k, $229/sqft.
HORLBECK CREEK 2016 SALES
2 Horlbeck Creek single family home sales, 2016, $435k, $475k.
IVY HALL 2016 SALES
15 Ivy Hall single family home sales, 2016, from $240k-$360k. Median $310k, $197/sqft.
LONGPOINT 2016 SALES
54 Longpoint single family home sales, 2016, from $265k-$1.2M. 3 over $700k. Median $463k, $195/sqft.
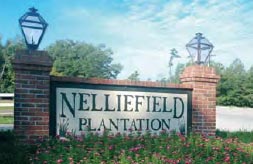 NELLIEFIELD 2016 SALES
40 Nelliefield single family home sales, 2016, from $258k-$365k. Median $315k, $147/sqft.
OYSTER POINT 2016 SALES
84 Oyster Point single family home sales, 2016, from $413k-$900k. Median $549k, $208/sqft.
PARK WEST SALES 2016
144 Park West single family homes sales, 2016, from $265k-$1.2M. Median $410k, $178/sqft. 2 over $800k.
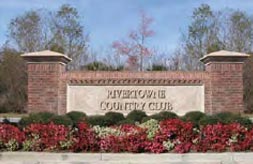 RIVERTOWNE 2016 SALES
100 Rivertowne single family homes sales, 2016, from $352k-$1.55M. 2 over $1M. Median sales price $504k, $197/sqft.
SNEE FARM 2016 SALES
61 Snee Farm single family home sales, 2016, from $210k-$908k. 1 above $775k. Median $420k, $198/sqft.
TUPELO 2016 SALES
55 Tupelo single family home sales, 2016, from $327k-$487k. Median $386k, $174/sqft.
SOUTH MOUNT PLEASANT
CANDLEWOOD 2016 SALES
5 Candlewood single family home sales, 2016, from $290k-$360k. Median $310k, $229/sqft.
COOPER ESTATES 2016 SALES
10 Cooper Estates single family home sales, 2016, from $425k-$848k. Median $543k, $249/sqft.
FIDDLERS MARSH 2016 SALES
5 Fiddlers Marsh single family home sales, 2016, from $402k-$665k. Median $456k, $200/sqft.
GLENLAKE 2016 SALES
6 Glenlake single family home sales, 2016, from $290k-$384k. Median $348k, $180/sqft.
HARBORGATE SHORES 2016 SALES
18 Harborgate Shores single family home sales, 2016, from $275k-$429k. Median $366k, $231/sqft.
HIDDEN COVE 2016 SALES
8 Hidden Cove single family home sales, 2016, from $368k-$1.25M. 1 over $600k. Median $456k, $194/sqft.
HOBCAW CREEK 2016 SALES
13 Hobcaw Creek single family home sales, 2016, from $530k-$1.3M. 2 over $800k. Median $600k, $202/sqft.
I’ON 2016 SALES
60 I’on single family home sales, 2016, from $460k-$2.4M. Median $939k, $323/sqft. 4 over $2M
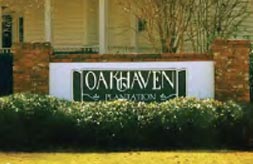 OAKHAVEN 2016 SALES
7 Oakhaven single family home sales, 2016, from $298k-$500k. Median $395k, $226/sqft.
OLD MOUNT PLEASANT 2016 SALES
47 Old Mount Pleasant single family home sales, 2016, from $291k-$1.15M. Median $450k, $316/sqft.
OLD VILLAGE
46 Old Village single family homes sales, 2016, from $245k-$4.6M. Median $993k, $378/sqft. 5 above $2M. 2 of those above $3M.
OLD VILLAGE LANDING 2016 SALES
6 Old Village Landing single family home sales, 2016 ,from $504k-$1.14M. Median $692k, $280/sqft.
SCOTTS CREEK 2016 SALES
4 Scotts Creek single family home sales, 2016, $665k, $710k, $770k, $781k.
SEASIDE FARMS 2016 SALES
22 Seaside Farms single family home sales, 2016, from $360k-$1.2M. 6 below $500k. 3 above $600k. Median
$550k, $212/sqft
SWEETGRASS 2016 SALES
25 Sweetgrass single family home sales, 2016, from $285k-$430k. Median $380k, $190/sqft.
WAKENDAW 2016 SALES
15 Wakendaw single family home sales, 2016, from $286k-$550k. 3 under $400k. Median $435k, $192/sqft.
WATERS EDGE 2016 SALES
13 Waters Edge single family home sales, 2016, from $327k-$405k. Median $359k, $179/sqft.
THE ISLANDS
DANIEL ISLAND 2016 SALES
198 Daniel Island single family home sales, 2016, from $445k-$2.3M. Median $796k, $256/sqft. 55 above $1M. 2 above $2M.
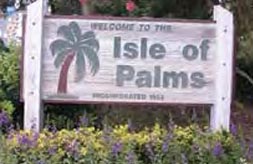 ISLE OF PALMS 2016 SALES
88 Isle of Palms single family home sales, 2016, from $220k-$5.15M. Median $990k, $405/sqft. 8 under $500k.19 over $2M. 7 of those over $3M.
SULLIVAN’S ISLAND 2016 SALES
58 Sullivan’s Island single family home sales, 2016, from $425k-$4.75M. 3 under $800k. 1 over 3M. Median $1.5M, $526/sqft.
WILD DUNES 2016 SALES
77 Wild Dunes single family home sales, 2016, from $475k-$3.2M. Median $845k, $367/sqft. 26 over $1M. 5 over $2M.


Leave a Reply